Help Center Budgets
Budget charts and insights
Below a budget's totals, its charts compare each category with its budget and list your most frequent merchants and largest transactions for the period.
Updated
Choose the period a budget shows
A budget opens on the current month. A goal budget with dates opens on its whole date range instead. A budget that has ended opens on its last month.
- Open the budget from Budgets.
- Select the arrows beside the period at the top, such as Oct 2026, to step back or forward one period. A phone has no arrows: select the period and pick another one.
- For a week, a year or your own dates, select the period to open Budget period. Choose Week, Month, Year or Custom, pick the period, then select Set budget period.
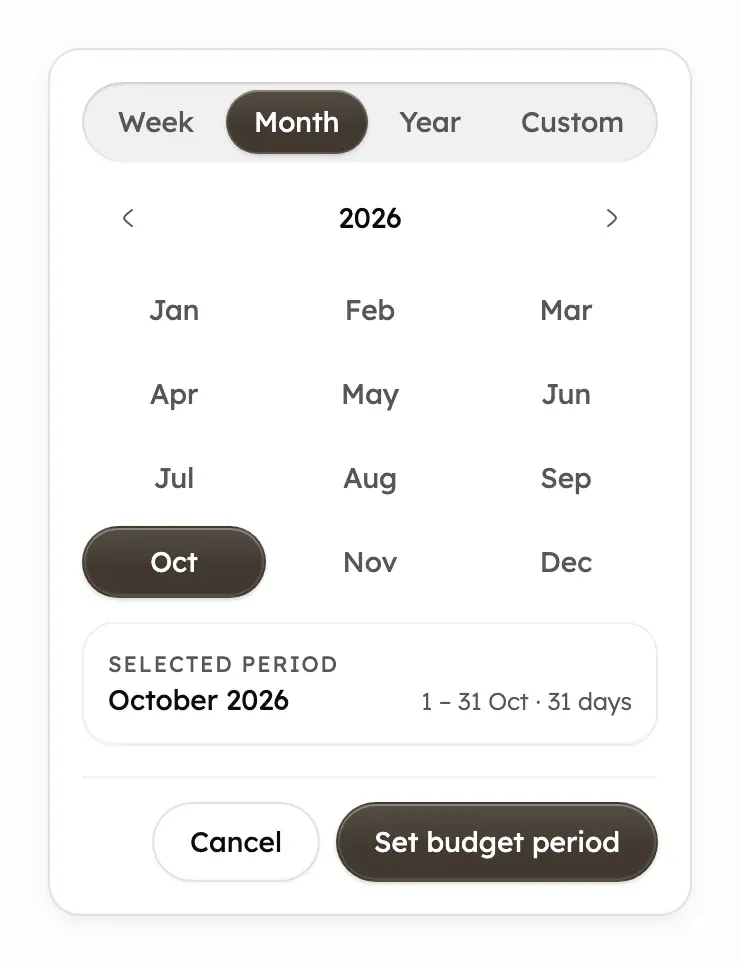
Every total, chart and the transactions list on the page then follow that period. Changing the period doesn’t change the budget. You can’t pick dates outside a budget’s date range. To see what each total counts, read Budget totals explained.
Why budgeted amounts change with the period
An ongoing budget keeps each category’s amount as a daily rate. Treasury counts a month as 30 days, a week as 7 and a year as 365. It then multiplies by the days in the period you view.
For example, $400 a month is about $13.33 a day. October has 31 days, so the budget shows $413.33. A week shows $93.33. These are example amounts.
A budget that starts or ends partway through a month counts only the days inside its dates. A goal budget shows each category’s full target, whatever period you view.
Progress bars for Income, Expenses and Savings
On a budget, a bar under Income, Expenses and Savings fills as money comes in or goes out against the budget. Select a bar to see Actual, Budgeted and how far you are from the budget.
- For Expenses, “under” is good and “over” means you spent more than you budgeted.
- For Income and Savings, “extra” is good and “under” means less than planned.
- “On target” means the two match exactly.
The Income bar is green, Savings blue and Expenses grey. Past the budget, the Expenses bar turns red, and Income and Savings show the extra in a lighter green.
Money flow chart
The money flow chart shows where money came from on the left and where it went on the right. It appears beside the totals only when a budget’s categories have both money in and money out in the period.
Each side shows its five largest categories, and groups the rest into one, such as Others (3). Select a category to see its amount. A refund in an expense category can appear on the money-in side.
Compare each category with its budget
On a budget, the Income, Expenses and Savings switch picks which categories the bars and table show. Categories appear A to Z, and a category group appears as one row.
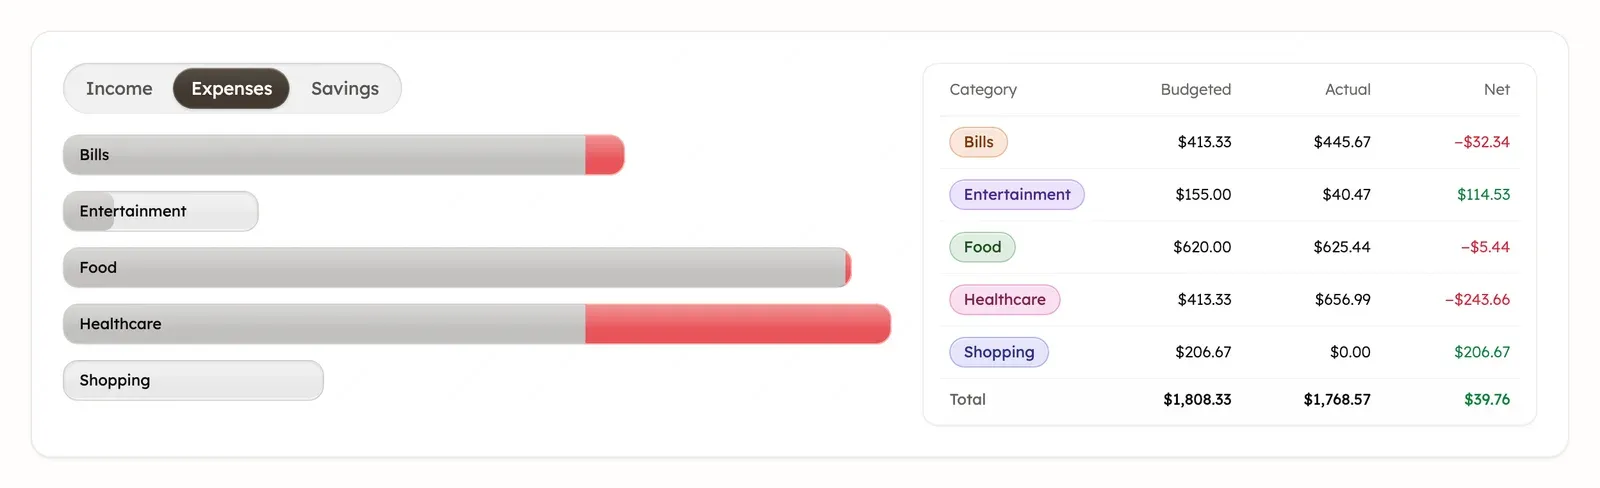
Each bar shows what you spent, earned or saved against the budget. Any part past the budget is red for expenses and green for income and savings. Select a bar to see its numbers in a sentence, such as “You spent $32.34 more than budgeted”. On a phone, each bar also ends with what’s left or over, or No budget.
What the category table shows
The table beside a budget’s bars lists each category’s Budgeted, Actual and Net for the period. Net is the difference between the two. Green means better than the budget, and red means worse.
Select a group’s name to show its categories. The Total row adds up every category of the type you chose.
Frequent Merchants and Largest Transactions
Frequent Merchants lists the five names with the most transactions in a budget’s period. The number after a name, such as x4, counts its transactions. Switch between TOTAL and AVG to see the total or the average amount.
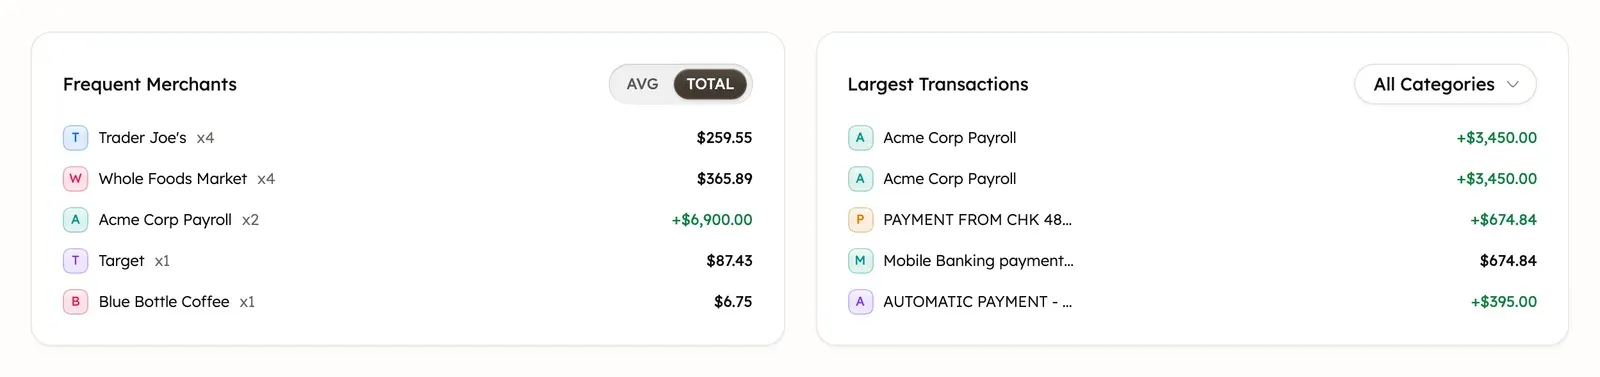
Largest Transactions lists the five biggest transactions in the period, money in or out. To narrow it, select All Categories and choose a category or Uncategorized.
Both cards leave out excluded and deleted transactions. When the period has no transactions, neither card appears.
Why transfers show in Largest Transactions
A budget’s lists and cards include uncategorized transactions, though its budget totals don’t. So an uncategorized card payment or transfer can appear in Largest Transactions or Frequent Merchants.
To keep transfers out, give them a category the budget doesn’t include, or exclude them. See If transfers make budget totals look too high.
Was this helpful?
Related guides
Questions about your own money?
Treasury AI can look through your accounts, budgets and transactions and answer in plain language. Something not working? Email support@treasury.sh.